
Influenza (FLU) Update for Week Ending 12-7-19
Influenza (FLU) Update for Week #49 — Week Ending 12-7-19
The CDC reported that seasonal flu is in full swing, with all regions of the US having elevated ILI and flu activity continues to increase. Most of the current flu activity is caused by Influenza B/Victoria which more typically occurs toward the end of the flu season. A(H1N1) is the next most common and seems to be increasing compared to the other flu viruses, followed by A(H3N2) with a much smaller share. The CDC estimated that at this point in the season, there have been at least 2.6 million sick with flu, 23,000 hospitalizations, and 1,300 deaths. Influenza-like illness (ILI) is defined as a temperature at/above 100o F [37.8o C] and cough and/or sore throat without a known cause other than flu. A Flu case, that is included in CDC data, indicates a positive flu test read by either a Clinical or Public Health Lab.
Diagnosed Flu and ILI are expected to continue to increase over the next few weeks and flu activity is likely to persist for several more months. It is recommended by public health officials & health care providers that for all those 6 months or older, flu vaccinations should be completed ASAP unless they have a valid medical contraindication. Most will receive a vaccination that covers 4 strains of influenza.
The severity of Flu & ILI for this season, as well as which viruses will ultimately dominate, is still too early to identify, but there are hints that this season may be more severe than many, since most recent seasons have hit the national threshold for ILI typically between weeks #48 and #50, but this season hit the threshold at week #45. As more data is collected by the CDC further into the season, its severity and other report components will be included in this Summary.
See this link for more details, including charts, graphs, and maps: https://www.cdc.gov/flu/weekly/index.htm
FirstWatch RIN (Reginal Influenza Network) Alerts increased significantly over previous weeks.
For the most recently reported week ending December 7, 2019, the CDC reported:
–ILI visits to clinics and other non-hospital facilities was at 3.2%, lower than last week’s 3.5% and above the national baseline of 2.4%, but the decrease may be due to less patients going to health care providers during Thanksgiving week. The regional range was between 1.8% and 5.7% for Week #49. All ten regions reported that outpatient visits for ILI were at/above their own regional baselines.
–Flu cases, documented by positive flu tests from Clinical Labs, showed that 11.3% of respiratory specimens tested for influenza were positive, which is higher than last week’s report of 10.2%.
— For this reporting period, viewed nationally, influenza B/Victoria viruses were reported more frequently than influenza A(H1N1)pdm09 and, even less reported were influenza A(H3N2) viruses. There were significantly more influenza B than A and an even greater difference between H1N1 than H3N2. The predominant strain varied by region and patient age. To access specific state and regional information on circulating flu viruses, please see: https://gis.cdc.gov/grasp/fluview/fluportaldashboard.html
—Clinical Labs, which test many specimens to determine whether flu cases are increasing, decreasing, or staying stable, as well as a simple breakdown of A and B flu percentages, reported that there were 11.3% positive flu specimens with 68.5% influenza B and 31.5% influenza A.
—Public Health Labs report data which has a more limited number of specimens but provides a more specific breakdown of specific flu virus strains. Influenza B was detected at 55.2% and Influenza A at 44.8%. Further breakdown revealed that Influenza B showed 97.5% Victoria lineage and 2.5% Yamagata, while H1N1 is the dominant A with 83.7% with H3N2 at 16.3%. Influenza B viruses are typically seen in greater numbers nearer the end of the flu season rather than the beginning and may be a tougher flu for children.
–Vaccine Coverage: Testing of Influenza A(H1N1) samples revealed that all samples tested were well matched with the components in the 2019-20 flu vaccine, while 70.6% A(H3N2) Influenza virus samples matched; only 62.5% B/Victoria virus samples were a similarly matched but B/Yamagata samples matched 100%.
The CDC provides an interactive U.S. map that will link to each state’s public health authorities, ILI and Flu information and processes, as well as other diseases and public health topics. This site includes a tremendous amount of information at the State, and even Local, level.
Find it at this site: https://www.cdc.gov/flu/weekly/usmap.htm
—For Influenza-Like Illness (ILI)
High ILI Activity (Puerto Rico & 11 states): Alabama, Arkansas, Georgia, Mississippi, Nebraska, New Mexico, South Carolina, Tennessee, Texas, Virginia, and Washington
Moderate ILI Activity (New York City & 11 states): Arizona, Colorado, Connecticut, Hawaii, Kentucky, Maryland, Minnesota, Nevada, New Jersey, Oklahoma, and Oregon
Low Activity (Washington D.C. & 9 states): California, Florida, Illinois, Kansas, Massachusetts, New York, North Carolina, Pennsylvania, and Wisconsin
Minimal Activity (18 states): Alaska, Delaware, Idaho, Indiana, Iowa, Maine, Michigan, Missouri, Montana, New Hampshire, North Dakota, Ohio, Rhode Island, South Dakota, Utah, Vermont, West Virginia, and Wyoming
Insufficient Data to Calculate: U.S. Virgin Islands & Louisiana
—For Flu (positive Flu tests)
Widespread Activity (23 states): Alabama, Arizona, California, Connecticut, Georgia, Idaho, Indiana, Kentucky, Louisiana, Maryland, Massachusetts, Nebraska, Nevada, New Mexico, New York, North Carolina, Oregon, Pennsylvania, South Carolina, Tennessee, Texas, Virginia, and Washington
Regional Activity (Puerto Rico & 14 states): Arkansas, Colorado, Florida, Illinois, Michigan, Minnesota, Mississippi, Montana, New Jersey, Ohio, Oklahoma, Rhode Island, Utah, and Wisconsin
Local Activity (12 states): Delaware, Hawaii, Iowa, Kansas, Maine, Missouri, New Hampshire, North Dakota, South Dakota, Vermont, West Virginia, and Wyoming
Sporadic Activity (Washington D.C., U.S. Virgin Islands, & 1 state): Alaska
No Activity: (0 states):
No Report: Guam
—Other Data:
Hospitalizations from Flu: There were a total of 1,139 lab-confirmed influenza-related cases that were hospitalized reported between 10/1/19 and 12/7/19. The hospitalization rate for all ages increased to 3.9 per 100,000. The highest rate was in those aged > 65 years (9.4/100,000), then children ages 0-4 (7.5/100,000), and then adults ages 50-64 (4.1/100,000). The vast majority were from infections with influenza A (55%), 43.8% with influenza B, 0.5% with both influenza A and B co-infection, and 0.6% which did not have a flu type determined (CDC numbers total 99.9%). For the influenza A positives that had subtyping performed, 70.5% were A(H1N1) and 29.5% were A(H3N2).
Death rates for pneumonia & influenza in adults: from data as of 12/12/19, 5% of adult deaths during week #48 (ending 11/30) were associated with influenza and pneumonia. This is below the epidemic threshold of 6.5% for that week. This data reporting typically lags a week or more behind the reporting week.
Four (4) pediatric death associated with influenza was reported during week #49; one of them was from week #47, making a total of 10 flu-associated pediatric deaths for the 2019-20 Flu Season. Six (6) of the cases were influenza B with three (3) from B/Victoria and four (4) were typed as influenza A.
Canada:
Flu in Canada for Week #49 (12/1 – 12/7, 2019):
According to the Public Health Agency of Canada (PHAC), influenza activity increased with 64% of the regions reporting influenza activity; 76% as sporadic and 24% as localized. Influenza A(H3N2) continued to be the most common flu virus circulating (56%), while Influenza B increased to 44%. A(H3N2) accounted for 65% of Influenza A positive specimens. All 53 Regions reported. The majority of hospitalizations have been A(H3N2), while in the pediatric populations, 50% were influenza B.
Localized Activity in 8 Regions (15%): Quebec (2), Ontario (2), Manitoba (1), Saskatchewan (1), Alberta (1), British Columbia (1)
Sporadic Activity in 26 Regions (49%): Newfoundland & Labrador (2), Nova Scotia (1), New Brunswick (2), Quebec (4), Ontario (4), Manitoba (3), Saskatchewan (2), Alberta (4), British Columbia (3), Yukon Territory (1)
No Activity in 19 Regions (36%): Newfoundland & Labrador (2), Prince Edward Island (1), Nova Scotia (3), New Brunswick (5), Ontario (1), Manitoba (1), British Columbia (1), Northwest Territory (2), Nunavut (3)
PHAC Flu Watch Summary & Influenza/ILI Activity Map for Week #49 see: https://www.canada.ca/en/public-health/services/publications/diseases-conditions/fluwatch/2019-2020/week-49-december-1-7-2019.html
PHAC Home Page for Surveillance on Flu: https://www.phac-aspc.gc.ca/fluwatch/
Public Health Agency of Canada (PHAC) Home Page for Information on Flu:
https://www.canada.ca/en/public-health/services/diseases/flu-influenza.html
PHAC Provides Flu Watch Summary & Link to Full Influenza Reports Past & Present:
https://www.canada.ca/en/public-health/services/diseases/flu-influenza/influenza-surveillance/weekly-influenza-reports.html
PHAC Interactive Map for Flu Activity Across Canada:
https://www.canada.ca/en/public-health/services/diseases/flu-influenza/influenza-surveillance/map-activity-levels.html
PHAC Site that Explains How to Become a Canadian Flu Watcher:
https://www.canada.ca/en/public-health/services/diseases/flu-influenza/fluwatcher.html
Europe:
European Center for Disease Prevention & Control – Flu for Week #49 (12/2 – 12/8, 2019):
Influenza activity continued to increase across Europe with some countries reporting increased intensity and spread, although most still reported rates at or below baseline. For the third week in a row, specimens tested positive for flu for those going to sentinel PCPs for ILI and ARI at greater than 10%. The majority of flu cases were from Influenza A, although six (6) countries reported more cases of influenza B, and two (2) more countries reported dominance of both A and B. Data from 23 countries/regions reported mortality from all causes were at expected levels for this time of year.
For more info see: https://flunewseurope.org/
Public Health England Flu Summary:
https://www.gov.uk/government/statistics/weekly-national-flu-reports
Global:
World Health Organization (WHO) Weekly Flu Summary (FluNet):
https://www.who.int/influenza/gisrs_laboratory/flunet/en/
WHO Global Flu Overview with Map and Text:
https://www.who.int/influenza/surveillance_monitoring/updates/latest_update_GIP_surveillance/en/
Global Epidemiology Reports:
WHO Collaborating Centers for Flu in Australia, Japan, & the United Kingdom
First Responder Specific Information
There are many websites that may be helpful in planning and managing seasonal flu within First Responder organizations. A few of those websites are included here:
NIOSH on Flu for Employers/Employees:
https://www.cdc.gov/niosh/topics/flu/
NIOSH Listing on Absenteeism in the Workplace throughout the US:
https://www.cdc.gov/niosh/topics/absences/default.html
Protection from Flu:
https://www.cdc.gov/flu/protect/habits/index.htm
World Map Showing Flu & Other Infectious Diseases:
https://www.healthmap.org/en/
- First Responders should be vaccinated for Flu each season to prevent getting flu themselves, taking it home to family members or transmitting it to patients in their care. Family members and patients may be at increased risk of complications from flu.
- Perform proper hand hygiene including frequent handwashing with soap and water, and the use of hand sanitizers in general, and particularly when providing patient care or after touching surfaces.
- Masks (N95 or 100) should be used in the presence of patients with cough and/or fever. Procedure or surgical masks can also be used but may not provide the same level of protection.
- Care should be taken to avoid touching their own face and mucous membranes (eyes, mouth, nose) since the flu virus is frequently found on surfaces such as door knobs, cot and equipment handles, phones, as well as clothing, bed clothes, etc. Once picked up on the hands from touching inanimate objects or from the secretions of a patient, it can transmit the flu (or any respiratory infection virus) via the mucous membranes of the face and head.
- Report signs/symptoms of flu to your physician or other appropriate provider for early assessment and care. Signs & symptoms suggest a period of contagiousness and out your patients and co-workers at risk.
- Cough and sneeze into your sleeve, if a tissue is not available, and not onto your hands.
- Stay away from others if you are sick.
- Be aware of your exposure risk and history. Take extra precautions or avoid those with immunocompromise, when possible, if you have a known or likely exposure.
- Antivirals may be indicated for the treatment of flu, particularly for those in high risk groups, those who are hospitalized or have severe, complicated or progressing flu. Those that present with 48 hours of the onset of symptoms may also be given antivirals, based on PCP judgement but make sure the practitioner is aware of their Frist Responder Role. See https://www.cdc.gov/flu/antivirals/whatyoushould.htm
- Flu is much more worrisome for the very young and the very old. Signs of ILI in this group requires careful assessment to rule out complications and these groups are much more likely to need to be transported to assure adequate care. Young children and those over 65 are typically at greater risk for complications, hospitalization, and even death. Hospitalization rates may also be elevated in those aged 50-64. Consideration should perhaps be given to monitoring these groups more closely, with inclination for more comprehensive assessment and transport for further evaluation, when presented with possible flu and any signs of complications.
Complications of flu, sometimes requiring hospitalization and even leading to death, tend to occur after the person has begun to get better from the flu and then appears to relapse. EMS personnel may want to look more closely at those patients when the call is not about the initial signs and symptoms of flu, but about increasing or different signs that have appeared.
- A study was published by the Institute for Clinical Evaluative Sciences in NEJM:
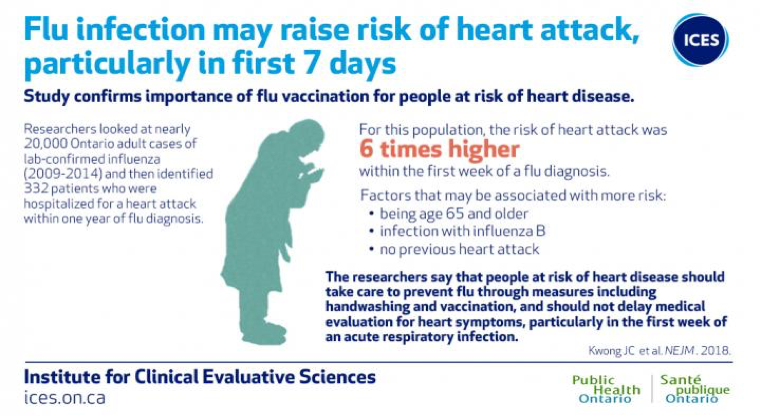
Image courtesy of ICES/PHO “The researchers add that patients should not delay medical evaluation for heart symptoms particularly within the first week of an acute respiratory infection.” (Lisa Schnirring, News Editor: CIDRAP News; Jan 25, 2018)
For more information on the Influenza and Heart Attack Study, please see the link below.
https://www.eurekalert.org/pub_releases/2018-01/pho-rcl011818.php