Influenza (FLU) Update for Week Ending 6-1-19
Influenza (FLU) Update for Week #22 — Week Ending June 1, 2019
The CDC reported Flu & ILI activity remained low throughout the nation during Week #22. This year’s Flu Season has finally ended, although flu cases will likely continue to occur in small numbers, with flu-related hospitalizations, and perhaps adult & pediatric deaths due to flu, taking place occasionally.
This Influenza Update will conclude FirstWatch’s reporting for the 2018-2019 Flu Season with a summary of this week’s stats, as well as some seasonal cumulative data that may be of interest.
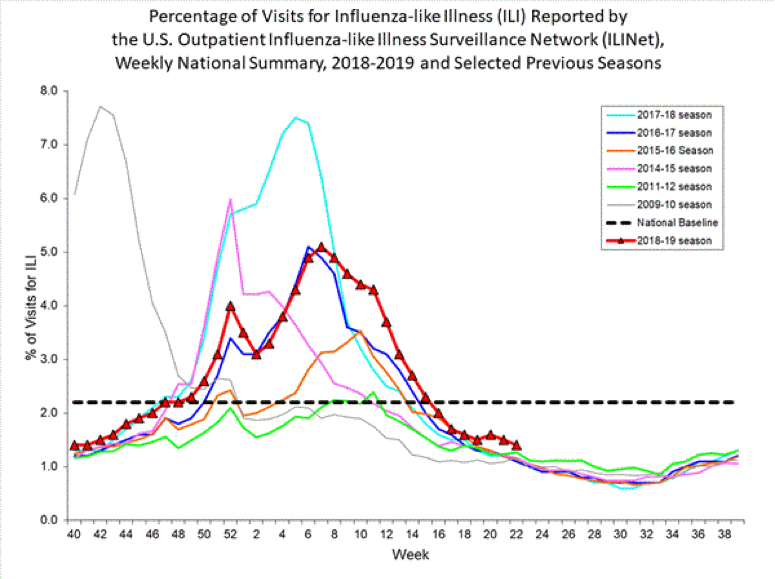
Influenza-like illness (ILI) visits to clinics & other non-hospital facilities decreased to 1.4%, well below the national baseline of 2.2% and at a level seen outside of seasonal flu activity.
The CDC chart copied below, was found within the Weekly U.S. Influenza Surveillance Report for Week #22, and represents the number of ILI-related visits to up to 3500 primary health care providers from every state, the District of Columbia (Washington, D.C.), Puerto Rico, and the U.S. Virgin Islands enrolled in ILINet throughout the year. This Flu Season’s cases are represented with the red triangles and line, showing a record long season. Other flu seasons are represented by different colors and can be identified by using the legend to the right. Note the 2017-2018 season which was responsible for the overall worse season in many years and the 2009-2010 season which starts early because it began as a pandemic and transitioned into the seasonal flu that year.
For this Flu Season, Influenza A(H1N1)pdm09 was dominant from Oct through mid-Feb; Influenza A(H3N2) became and stayed dominant as of late Feb. Only small numbers of Influenza B circulated with a rise in the last few weeks but less than typical.
Using CDC data from the past three weeks only, there was a distribution of flu viruses as follows:
- From clinical health labs testing influenza specimens, it was 51% Influenza A & 49% Influenza B viruses.
- Further breaking it down, from public health labs, it was 64.3% H3 & 35.7% H1N1pdm09 subtypes of Influenza A, and 80.8% Victoria and 19.2% Yamagata lineages.
During Week #21, a novel Influenza A(H1N1) variant virus caused a human infection in Michigan; it has the nomenclature of A(H1N1)v. The patient was in the > 65 year category, was hospitalized, did well, and is now completely recovered. There was no reported exposure to swine (pigs) so there is an ongoing investigation into how this person was exposed. This is the only one variant influenza reported for 2019.
These novel A viruses, or variants, are significant because they suggest exposure to what is typically a swine influenza while in pigs, but is renamed a variant after infecting a human. Identification of even one variant case, and an investigation into how and where the variant exposure occurred is essential to determining the risk to humans and what measures to protect the human population can be made. Through the years, many of these swine influenza variants have been discovered in small pockets associated with county/state fairs, or other agriculture events. In very rare cases, variant influenza viruses, which are different from seasonal influenza viruses, can be the start of a pandemic. To prevent these cross infections, one ongoing measure has been to provide soap and running water at tents with livestock so humans, who have had any interaction with the livestock at all, can wash their hands before moving onto the next event.
FirstWatch RIN (Regional Influenza Network): RIN Alerts for Week #22 occurred rarely.
The CDC provides an interactive U.S. map that will link to each state’s public health authorities, providing ILI & Flu information and processes, as well as other diseases and public health topics. Although flu data for this season halted after Week #20 (week ending May 18, 2019 at the national level), states may still post respiratory illnesses, information related to Flu/ILI, as well as other outbreaks and public health info.
Find it at this site: https://www.cdc.gov/flu/weekly/usmap.htm
See this link for more details on Flu and ILI activity, including charts, graphs and maps: https://www.cdc.gov/flu/weekly/index.htm
There is no current Flu or ILI Map or list provided by the CDC.
Other Data:
The CDC chart copied below, was found within the Weekly U.S. Influenza Surveillance Report for Week #22, and displays the rate of hospitalizations for the 2018-19 Flu Season. The various colored lines represent the different age groups (see the legend to the left). Since the largest group of hospitalizations is in the > 65 year age range, this range has been further divided and each sub-group have their own colored line.
Hospitalization Rate (per 100,000) Related to Flu Cumulative over Time & Distributed by Age:
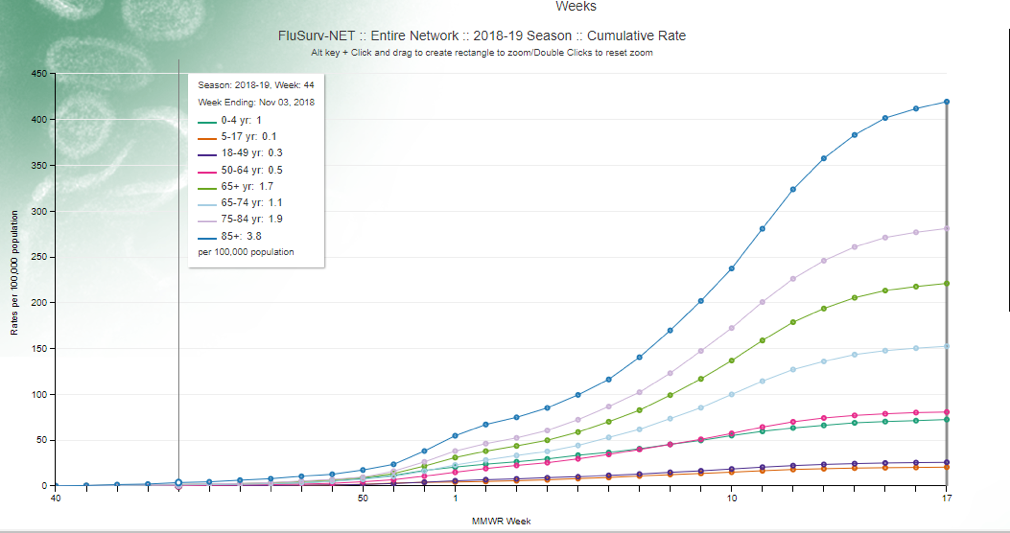
Cite: “Flu View: Influenza Hospitalization Surveillance Network, Centers for Disease Control and Prevention Website. Accessed on June 9, 2019”
Adult Mortality from Pneumonia and Influenza (P & I):
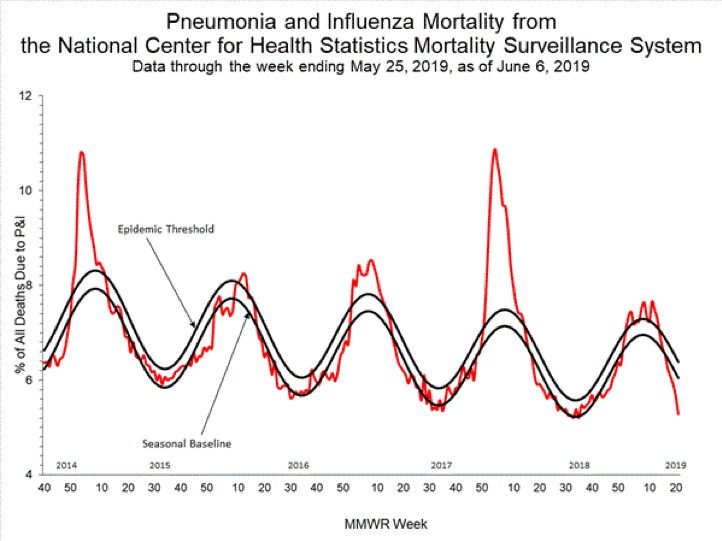
As of 6/6/19, the death rate for pneumonia & influenza in adults was at 5.3% and below the epidemic threshold of 6.4% for week #21.
The CDC chart copied below, was found within the Weekly U.S. Influenza Surveillance Report for Week #22. The chart compares rates for adult mortality from pneumonia and influenza, for the flu seasons of 2014-15 through 2018-19. The upper black line is the epidemic threshold and the lower black line is the national baseline for that time period. The red line reports the actual mortality percentage. When the red line is above the upper black line, adult mortality is above the epidemic threshold for that time period (the epidemic threshold varies according to the week).
The complications and deaths that occur due to influenza, whether seasonal or novel, must be investigated to decrease their likelihood. Ideally, influenza would be prevented, thus also preventing any sequela, but the mortality has to be better controlled. The CDC, other public health authorities, as well as interested stakeholders, must continue their attention, identification and prevention efforts. Some of these efforts include constant work to develop a universal vaccine, changes to flu immunization recommendations and practices for those most likely to succumb to morbidity and mortality, as well as expansion of antivirals.
Updated recommendations and practices have to be adopted for all those eligible, and educational efforts into the why and how of infection must be conveyed in every possible way to create change.
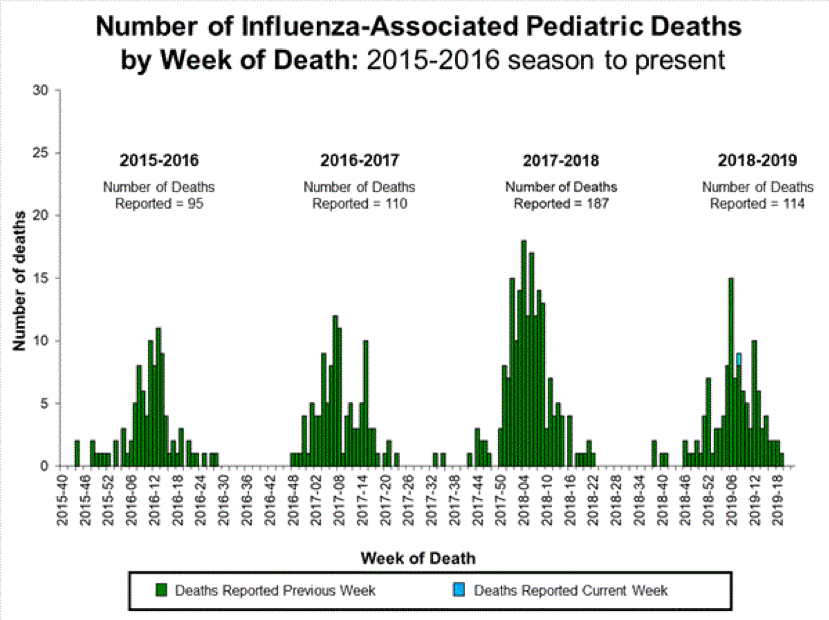
Pediatric Mortality:
There was one (1) pediatric death that was reported to the CDC during Week #22 but it occurred during Week #8. This places the total deaths reported for this flu season at 114.
The CDC chart copied below, was found within the Weekly U.S. Influenza Surveillance Report for Week #22, and represents the number pediatric deaths, by week, for the years 2015-16 through 2018-19.
Canada:
According to the Public Health Agency of Canada (PHAC), Week #20 was the last weekly FluWatch report for this season.
Canadian Flu Information: https://www.canada.ca/en/public-health/services/diseases/flu-influenza.html
Europe:
According to the European Center for Disease Prevention & Control (ECDC), Week #20 (May 13-20, 2019), was the last weekly report for the 2018-19 season. Their weekly report will resume Oct. 11, 2019 for the 2019-20 season.
For more information see: https://flunewseurope.org/
World: The World Health Organization (WHO) provides info on Influenza in Member Countries here: https://www.who.int/influenza/surveillance_monitoring/en/